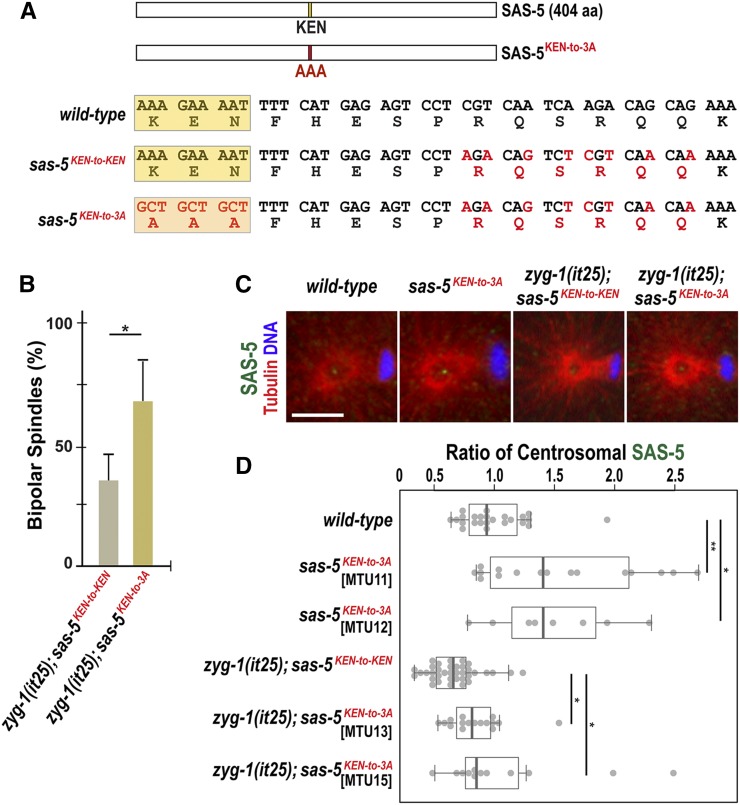
Figure 5.
Mutation of the SAS-5 KEN-box leads to increased SAS-5 levels at centrosomes and restores centrosome duplication to zyg-1(it25) mutants. (A) SAS-5 contains a KEN-box (aa 213–216) motif. Mutations (red) are introduced at multiple sites to make alanine substitutions (AAA; 3A) for the KEN-box and additional silent mutations for the CRISPR genome editing (see Materials and Methods). The KEN-box is highlighted in yellow. Note that the sas-5KEN-to-KEN mutation contains the wild-type SAS-5 protein. (B) Quantification of bipolar spindle formation during the second cell cycle in zyg-1(it25); sas-5KEN-to-KEN and zyg-1(it25); sas-5KEN-to-3A embryos at 22.5°. zyg-1(it25); sas-5KEN-to-3A double mutant embryos produce bipolar spindles at a higher rate (67.5 ± 16.3%, n = 124, P = 0.02) than zyg-1(it25); sas-5KEN-to-KEN controls (35.1 ± 10.7%, n = 164). n is the number of blastomeres. Average values are presented and error bars are SD. (C) Centrosomes stained for SAS-5 (green) during the first anaphase. Bar, 5 μm. (D) Quantification of centrosomal SAS-5 levels during the first anaphase. We used two independently generated sas-5KEN-to-3A mutant lines to quantify SAS-5 levels (MTU11 and 12, Table S1 in File S1). SAS-5 levels at centrosomes are normalized to the average fluorescence intensity in wild-type centrosmes. Mutating the SAS-5 KEN-box leads to increased levels of centrosomal SAS-5 in both MTU11 (1.54 ± 0.63-fold, n = 16; P = 0.04) and MTU12 (1.48 ± 0.50 fold, n = 8; P = 0.03), compared to wild type (1.00 ± 0.29-fold; n = 24). Consistently, there are a significant increase in centrosomal SAS-5 levels in both zyg-1(it25); sas-5KEN-to-3A double mutant lines (MTU13: 0.85 ± 0.24-fold, n = 16; P = 0.01 and MTU15: 1.09 ± 0.59-fold; n = 12; P = 0.03), compared to zyg-1(it25); sas-5KEN-to-KEN control that contains reduced levels of centrosomal SAS-5 (0.67 ± 0.20-fold; n = 36). n is the number of centrosomes. Each dot represents a centrosome. Box ranges from the first through third quartile of the data. Thick bar indicates the median. Solid gray line extends 1.5 times the interquartile range, or to the minimum and maximum data point. * P < 0.05, ** P < 0.01 (two-tailed t-test).

