Figure 2.
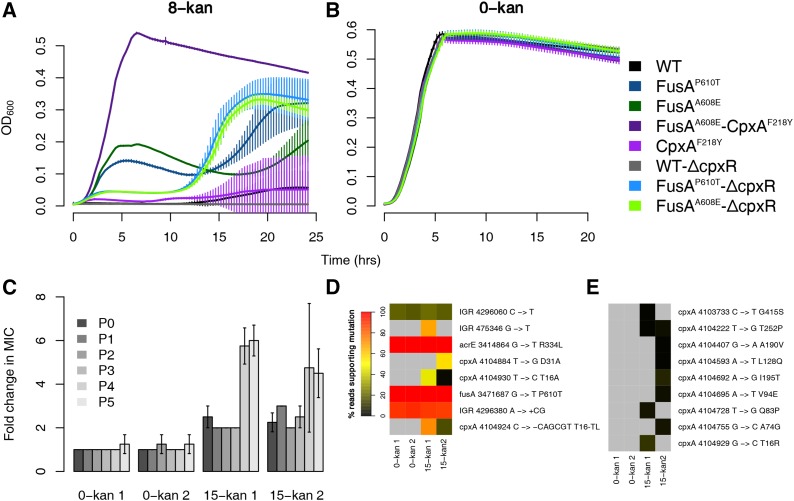
Activation of the Cpx response results in resistance. Growth curves in 8-kan (A) and 0-kan (B). The labels for the x and y axis are common. Plotted are the means from eight replicates with error bars representing SD. (C) Fold changes in MICs of populations evolved in 15-kan over the MICs of populations evolved in 0-kan. Two replicate populations grown in either 0-kan or 15-kan are shown. MICs of evolving populations at the end of growth (24 hr) after each batch transfer were determined and are represented by P0-P5. The MIC of the 0-kan 1 population at P0 was used to calculate fold changes. Error bars represent SD of four replicates. (D) Heatmaps showing the abundance of variants revealed by sequencing of both control and evolved populations. The color represents the percentage of reads supporting mutations, and is an approximate proxy for the abundance of the mutation. The list of variants was trimmed such that only mutations present in >20% of the reads in at least one sample were retained. (E) Heatmaps showing abundance of all low-frequency cpxA variants. The list of variants was trimmed to include only mutations in cpxA. The mutations shown in (D) are not shown here. The color scale is as shown in (D).

