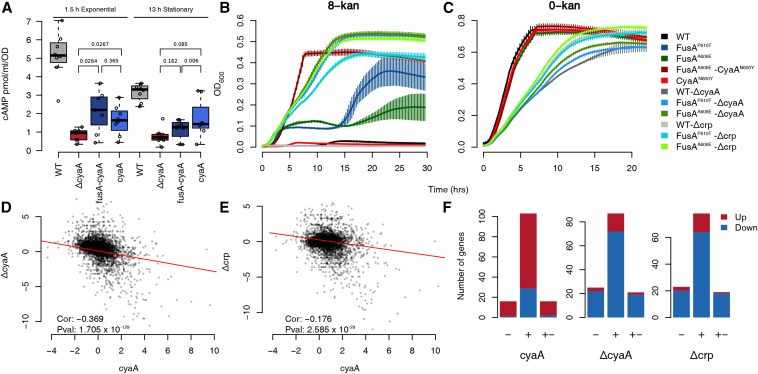
Figure 3.
Inactivation of adenylate cyclase results in resistance. (A) Boxplots showing the distribution of estimates of cellular cAMP concentrations of strains in the exponential and stationary phase. The difference between the wildtype and the other mutants are significant (P <1 × 10⁻²). P values for other relevant comparisons are mentioned in the plot. The FusAA608E-CyaAN600Y mutant is referred to as fusA-cyaA and the CyaAN600Y mutant as cyaA. (B and C) Growth curves in 8-kan (B) and 0-kan (C). The labels for the x and y axis are common. Plotted are the means from eight replicates with error bars representing SD. In the 8-kan growth curves, the huge error bars in some of the strains are produced when a few replicates start growing, possibly due to acquisition of some resistance conferring mutation, and thus this error cannot be eliminated. (D and E) Scatter plots comparing log2 fold-changes of genes in the CyaAN600Y mutant with those in the ΔcyaA (D)/Δcrp (E) knockout strains. The mutant is referred to by its gene name for brevity. The time-points for cell harvesting for RNA extraction of the ΔcyaA/Δcrp strains were similar to that of the mutants. The Spearman correlation coefficient and its P value are mentioned. (F) Barplots showing the number of targets of CRP present among the upregulated and downregulated genes in the CyaAN600Y, ΔcyaA and Δcrp strains. The numbers of positive (+), negative (−) and dual targets (+−) of CRP present among the upregulated (red) and downregulated (blue) genes are shown in the stacked barplots. Similar results are seen with the FusAA608E-CyaAN600Y mutant and are shown in Figure S9 in File S2.

