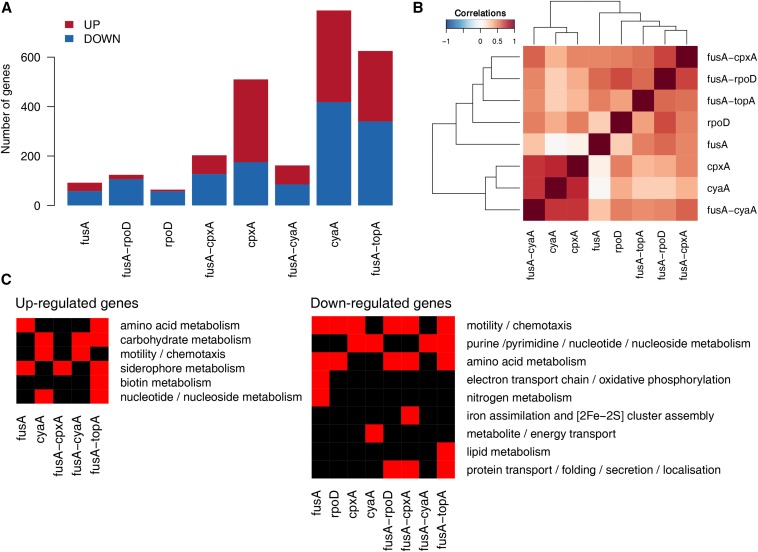
Figure 5.
Summary of differentially expressed genes across mutants. (A) Numbers of upregulated and downregulated genes in the mutants. Mutants are referred to by their gene names for brevity. (B) Heatmap showing the matrix of Spearman correlations among mutants. Fold changes of all genes were used to derive these correlations. (C) Heatmap showing enriched GO terms among the upregulated and downregulated genes in the mutants. Many GO terms have been combined to give this simplified picture.

