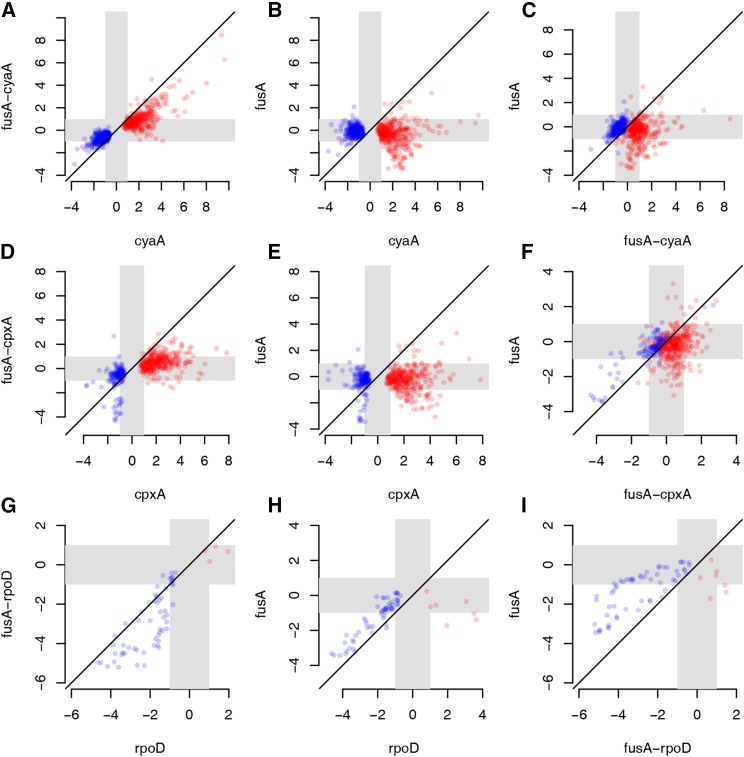
Figure 6.
Effect of second site mutations on gene expression and dependence on EF-G. Scatter plots comparing log2 fold changes of differentially expressed genes among mutants. Mutants are referred to by their gene names for brevity. Gray zones indicate the region between the log2 fold changes of +1 and −1 (corresponding to fold changes of 2 and 0.5), and thus highlights the region of low/no fold change. Red points show genes upregulated and blue points show genes downregulated in the relevant second site single mutant. (A–C) Fold changes of genes differentially expressed in the CyaAN600Y mutant were compared with the FusAA608E-CyaAN600Y and FusAA608E mutants. (D–F) Fold changes of genes differentially expressed in the CpxAF218Y mutant were compared with the FusAA608E-CpxAF218Y and FusAA608E mutants. (G–I) Fold changes of genes differentially expressed in the RpoDL261Q mutant were compared with the FusAA608E-RpoDL261Q and FusAA608E mutants.

