
Fig. 4.
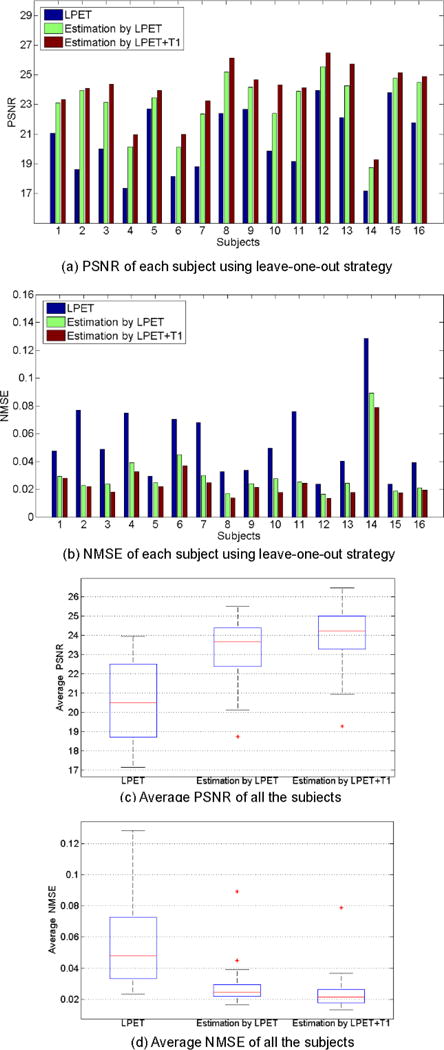
The performances of using different input image settings, measured by PSNR and NMSE. (a) and (b) give the PSNR and NMSE scores of each subject in the leave-one-out validation. (c) and (d) give the average PSNR and NMSE scores of all the subjects. ‘LPET’ indicates the PSNR/NMSE between the original LPET and the ground-truth SPET. ‘Estimation by LPET’ represents the scores of the results estimated using only LPET as the input. ‘Estimation by LPET+T1′ represents the scores of the results estimated using both LPET and T1 images.