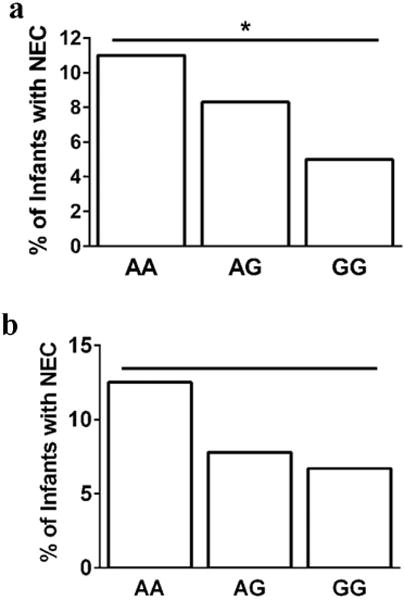
Figure 1. ATG16L1 variant genotypes and NEC in the (a) primary and (b) replication cohorts.

The proportion of infants who developed NEC stratified by their ATG16L1 (rs2241880) genotypes is shown. The N for NEC infants/all infants within each genotype are as follows: AA- 36/320; AG- 40/478; GG- 10/209. Cochran-Armitage tests were used to evaluate risk associated with the SNP. (a) * - p=0.009 (AA vs. AG vs. GG genotypes; Cochran-Armitage trend test). (b) p=0.30 (AA vs. AG vs. GG genotypes; Cochran-Armitage trend test).
