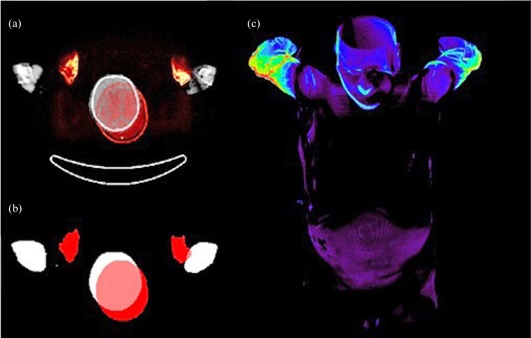
Figure 6.

The misalignment of the arms and head is demonstrated on the overlaid CT and MRI images (a). The same images are shown (b) after segmentation and labeling (MR, red; CT, white). 3D view of distance map for whole body for the worst case study (c).
