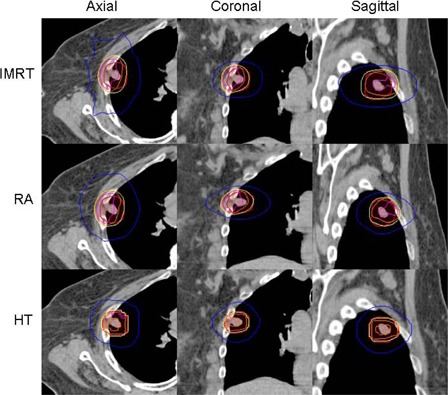
Figure 1.

From top to bottom: FF IMRT, RA, and HT. Axial, coronal, and sagittal views from one representative patient. Projected isodose lines are 110% (pink), 105% (orange), 100% (yellow), and 50% (blue) isodose lines.

From top to bottom: FF IMRT, RA, and HT. Axial, coronal, and sagittal views from one representative patient. Projected isodose lines are 110% (pink), 105% (orange), 100% (yellow), and 50% (blue) isodose lines.