Figure 2.

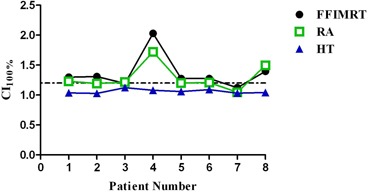
Conformity index () results for all patients. HT was lowest for all patients in study. Change in graph trend for patients 4 and 8 possibly explained by great overlap of patient's PTV with the chest wall. Dotted line represents .

Conformity index () results for all patients. HT was lowest for all patients in study. Change in graph trend for patients 4 and 8 possibly explained by great overlap of patient's PTV with the chest wall. Dotted line represents .