Figure 4.

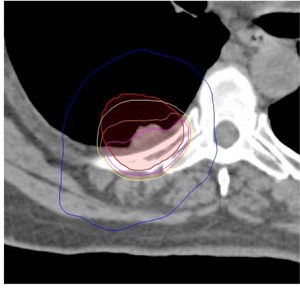
Isodose distribution in PTV at rib/chest wall interface. Isodose line projected: 110% (pink) 105% (orange) 100% (yellow) and 50% (blue) 110% hotspot falls almost entirely in rib/chest wall.

Isodose distribution in PTV at rib/chest wall interface. Isodose line projected: 110% (pink) 105% (orange) 100% (yellow) and 50% (blue) 110% hotspot falls almost entirely in rib/chest wall.