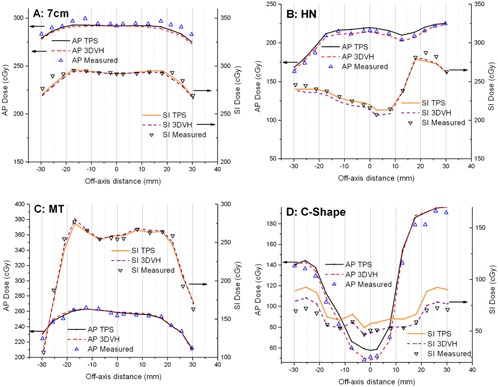
Figure 3.

AP (left axes) and SI (right axes) dose profiles for 7 cm target (a), mock head and neck (b), multi‐target (c), and C‐shape (d) VMAT plans. Pinnacle calculations (TPS), 3DVH measurement‐guided reconstruction (3DVH), and independent measurements ( chamber in the center) are compared. The left and right scales are shifted to separate the profiles for better visualization; otherwise AP and SI profiles would intersect at zero distance from the center. The central of every profile is through the unit‐density sphere, while the rest is through the lung material.
