
Figure 4.
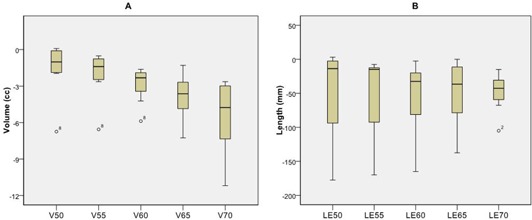
Box plot of change in dosimetric parameters after renormalization between the 11‐beam clinical and reduced esophageal dose plans for the eight patients with reduction in PTV coverage: change in esophageal volume (V; (a)), and length (LE; (b)) receiving doses of 50, 55, 60, 65, 70 Gy between the 11‐beam clinical plans and the reduced esophagus dose plans for patients whose beam outputs were increased to recover the 95% planning target volume of the clinical plan. the 75th and 25th percentile; the mean value; the range of data values; .