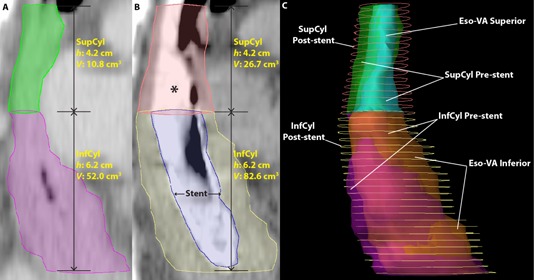
Figure 2.

Volume approximation structures. CT sagittal image pre‐stent (a) showing SupCyl (green) and InfCyl (magenta), with height (h) and volume (V) shown. CT sagittal image of same patient (b) after self‐expanding stent (SES: blue) placement showing SupCyl (pink) and InfCyl (yellow), with height (h) and volume (V) shown. Both the SupCyl and InfCyl post‐stent volumes are larger than the pre‐stent volumes due to SES‐induced esophageal expansion. The * denotes contrast media in the esophagus. The proximal end of the stent (blue) ends at the top of InfCyl. Right lateral 3D reconstruction (c) showing the differences in volumes between the pre‐stent, post‐stent, and VA structures. The post‐stent volumes (contours, SupCyl: pink, InfCyl: yellow) are visibly larger than the pre‐stent volumes (transparent, SupCyl: green, InfCyl: magenta) and the VA structures (Eso‐VA Superior: cyan, Eso‐VA Inferior: orange) more closely approximate pre‐stent volumes.
