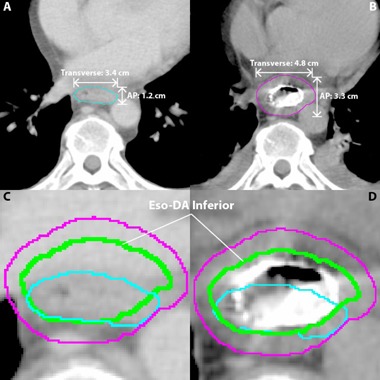
Figure 3.

Diameter approximation (DA) structures. The DA esophageal volume (green) is based on the difference in the AP and transverse measurements of the pre‐ (cyan) and post‐ (magenta) InfCyl structures. For the DA method, width of the pre‐ and post‐stent InfCyl (shown) and SupCyl (not shown) volumes were measured in the anterior/posterior (AP) and transverse directions on the superior, middle, and inferior slices of each respective volume. An average diameter difference for each of the three values was calculated for both the AP and transverse dimensions. The post‐stent SupCyl and InfCyl AP and transverse diameters were then altered by their respective differences to create new esophageal volumes, Eso‐DA Superior (not shown) and Eso‐DA Inferior (shown), to ultimately make a new PTV (PTV‐DA) (not shown). Axial CT (a) showing the AP and transverse measurements of the pre‐stent SupCyl structure (cyan). Axial CT (b) showing the AP and transverse measurements of the post‐stent SupCyl structure (magenta). For this patient on this slice stent placement increased the AP dimension by 2.1 cm and the transverse dimension by 1.4 cm. Pre‐stent CT axial section (c) now showing the Eso‐DA Inferior structure (green). Post‐stent CT axial section (d) now showing the Eso‐DA Inferior structure (green). InfCyl pre‐stent (cyan); InfCyl post‐stent (magenta); Eso‐DA Inferior (blue); Eso‐VA Inferior (green).
