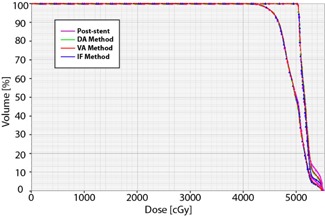
Figure 5.

Dose‐volume histograms for PTV Initial and PTV Boost. As seen here, the dose‐volume histograms for the PTV Initial (left curve) and PTV Boost (right curve) are essentially the same for the post‐stent and all pre‐stent approximation methods. Also, it is noticeable that of the PTV Initial received of the prescription dose of 45 Gy, and that of PTV Boost received of boost dose of 50.4 Gy.
