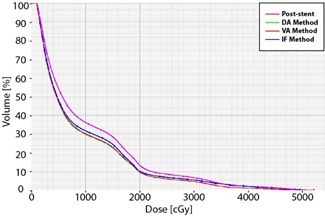
Figure 6.

Lung dose‐volume histograms for a typical patient. The post‐stent lung dose‐volume percentages (magenta) are greater than those of each of the pre‐stent approximations (DA method (green), VA method (red), and IF method (blue)). This difference is most apparent at lower doses.
