Figure 7.

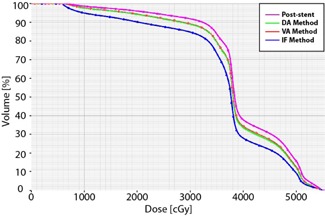
Heart dose‐volume histograms for a typical patient. The post‐stent heart dose‐volume percentages (magenta) are greater than those each of the pre‐stent approximations (DA method (green), VA method (red), and IF method (blue)).

Heart dose‐volume histograms for a typical patient. The post‐stent heart dose‐volume percentages (magenta) are greater than those each of the pre‐stent approximations (DA method (green), VA method (red), and IF method (blue)).