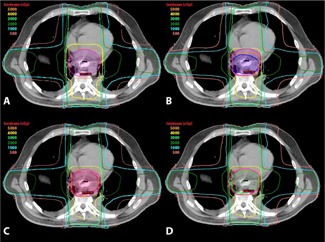
Figure 8.

Axial isodose distributions for the post‐stent, IF, VA, and DA plans, showing axial dosimetric images on the same transverse section for a typical patient: (a) isodose distribution for the post‐stent plan with post‐stent PTV (magenta); (b) isodose distribution for the IF plan with the IF PTV (blue) and the post‐stent PTV (magenta) for comparison. Note that the IF PTV plan involves less volume of the heart receiving high doses. Isodose distribution (c) for the VA plan with the VA PTV (red) and the post‐stent PTV (magenta), and for the DA plan (d) with the DA PTV (lime green) and the post‐stent PTV (magenta). Notice the dose to the heart and lungs is higher in the post‐stent (a) than any of the pre‐stent approximations ((b) – (d)). The IF plan shows the lowest dose to the heart and lungs.
