Figure 1.

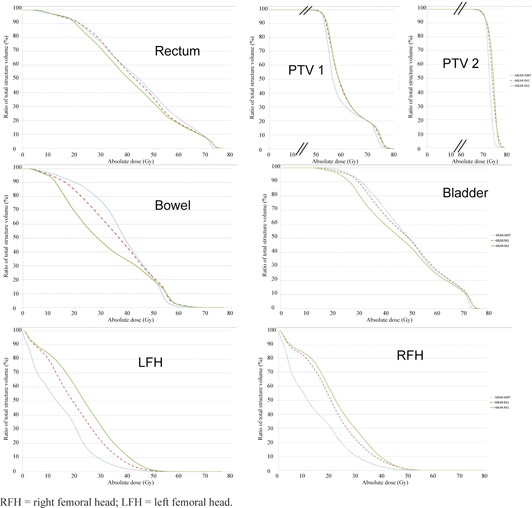
Mean OAR and PTV DVH plots for the ten patients with IMRT (in dashed blue), RA1 (in dashed red), RA2 (in green), x‐axis in gray, and y‐axis in percentage of the corresponding volume.

Mean OAR and PTV DVH plots for the ten patients with IMRT (in dashed blue), RA1 (in dashed red), RA2 (in green), x‐axis in gray, and y‐axis in percentage of the corresponding volume.