
Figure 1.
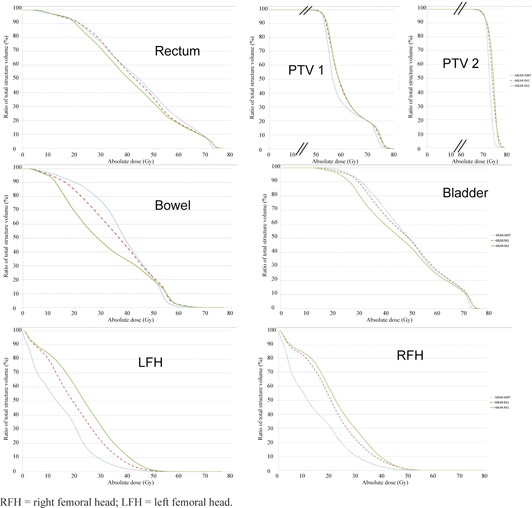
Mean OAR and PTV DVH plots for the ten patients with IMRT (in dashed blue), RA1 (in dashed red), RA2 (in green), x‐axis in gray, and y‐axis in percentage of the corresponding volume.
Official websites use .gov
A
.gov website belongs to an official
government organization in the United States.
Secure .gov websites use HTTPS
A lock (
) or https:// means you've safely
connected to the .gov website. Share sensitive
information only on official, secure websites.
Mean OAR and PTV DVH plots for the ten patients with IMRT (in dashed blue), RA1 (in dashed red), RA2 (in green), x‐axis in gray, and y‐axis in percentage of the corresponding volume.