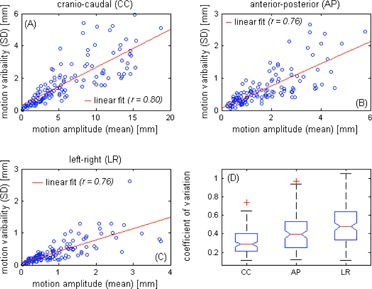
Figure 2.

Linear regressions of the motion amplitude and the motion variability (1 SD) in the craniocaudal (a), anterior‐posterior (b), and left‐right (c) directions. Each circle represents each of the 128 motion traces. The linear fits and Pearson's correlation coefficients of the data are also given. Box‐and‐whisker plot (d) of the coefficient of variation (CV) of each motion component is shown. Outliers with a value that is more than 1.5 times the interquartile range away from the top or bottom of the box are marked with ared + sign.
