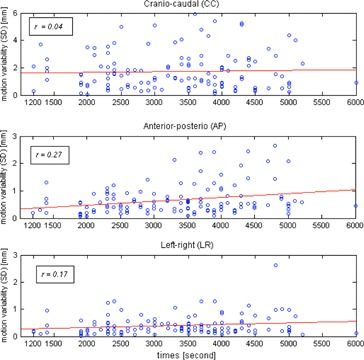
Figure 3.

Relationship between variability of motion amplitude (1 SD) and time for each motion axis. Each circle represents each of the 128 motion traces. The red lines are the best fits in the least‐square sense. The Pearson's correlation coefficients r are shown.
