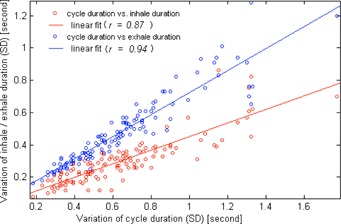
Figure 4.

Variation (1 SD) of cycle period was plotted against the variations (1 SD) of the length of exhale (blue dot) and inhale (red dot) states. Each circle represents each of the 128 motion traces. The linear fits and Pearson's correlation coefficients are also given.
