
Figure 4.
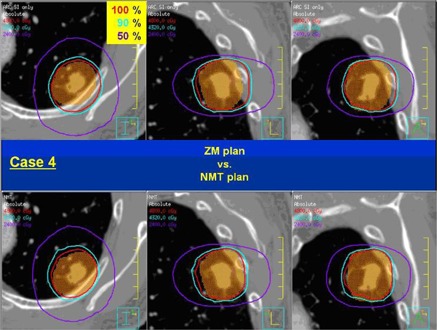
Dose distribution comparison between the ZM and NMT plan for Case 4: ZM plan (top), NMT plan (bottom), axial plane (left), sagittal plane (middle), and coronal plane (right).
Official websites use .gov
A
.gov website belongs to an official
government organization in the United States.
Secure .gov websites use HTTPS
A lock (
) or https:// means you've safely
connected to the .gov website. Share sensitive
information only on official, secure websites.
Dose distribution comparison between the ZM and NMT plan for Case 4: ZM plan (top), NMT plan (bottom), axial plane (left), sagittal plane (middle), and coronal plane (right).