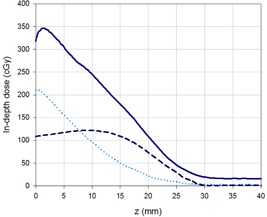
Figure 6.

In‐depth dose distributions measured at the AP axis for the contributions of: AP dual field (dashed line), anterior‐oblique fields (dotted line), and the complete treatment (solid line). The planned dose was of 100 cGy at for each dual field.
