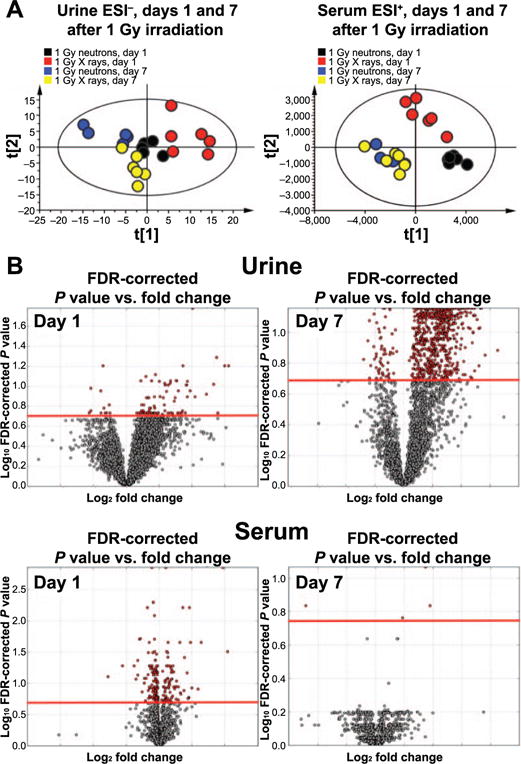
FIG. 1.

Multivariate and univariate data analysis of urine and serum metabolomics. Panel A: PCA analysis of urine ESI− data reveals distinct clustering of all 1 Gy groups, with time separation on component 1. Serum ESI+ data show time-dependent separation, with unique metabolic profiles for 1 Gy neutrons vs. X rays at day 1 only. Panel B: Volcano plot analysis for urine shows ions that are significantly perturbed on both days 1 and 7 postirradiation (red), while serum metabolomics is more informative at day 1.
