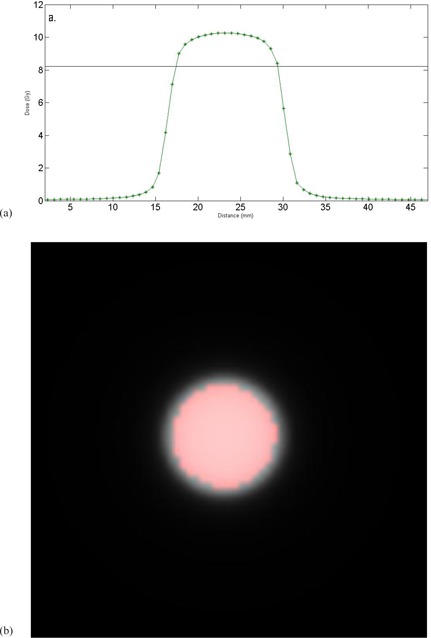
Figure 1.

(a) A 1D example of how the dose was determined. A profile through the center of a calculated plan dose is shown. The solid line shows 80% of the maximum dose. All pixels above the line would be used to determine the absolute dose to use for comparison. (b) A representative calculated dose plane. The red circle shows the pixels with of the maximum dose in the plane.
