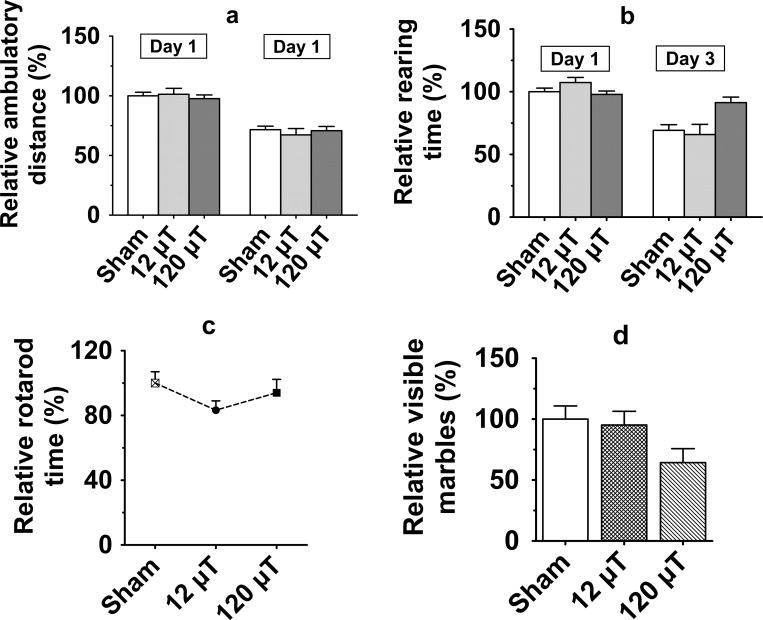
Fig 2. Motor performance in male mice after exposure to 7.5 kHz magnetic fields at 12 or 120 μT.
(a) Spontaneous exploratory activity; Relative ambulatory distance (gross horizontal locomotion) (b) Relative time spent for rearing in a novel test cage during 10-min free exploration (c) Relative latency to fall off from the Rotarod. (d) Marble burying test for neophobia. The y-axis values represent unburied marbles. To control for between-cohort differences, relative values (mean±SEM) are shown in relation to the value observed in the sham-exposed group of each cohort. (n = 20 in each exposed group, n = 30 in the sham-exposed group, except in the Rotarod test, in which n = 20 in the sham-exposed and 120 μT groups, n = 10 in the 12 μT group).

