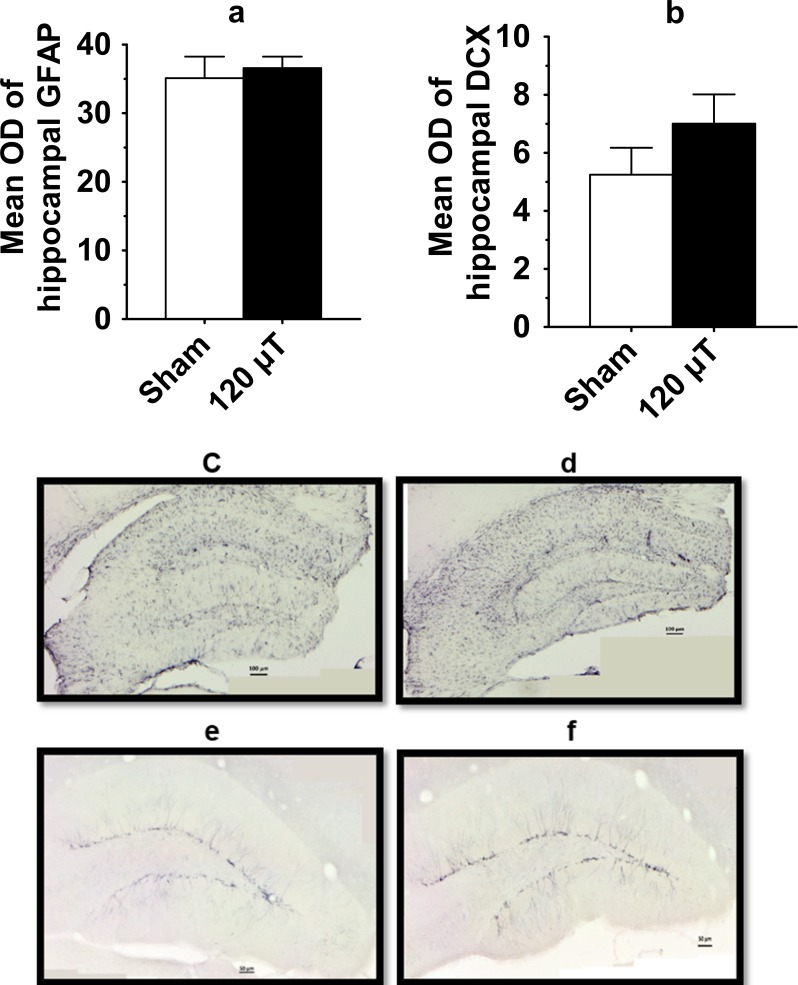
Fig 5. Histological analysis of the coronal sections of the septal hippocampus in male mice after exposure to 7.5 kHz magnetic fields at 120 μT.
(a) The mean optic density (OD) of hippocampus stained for glial fibrillary acidic protein (GFAP) to visualize activated astrocytes. (b) The mean optic density of hippocampal doublecortin (DCX) staining to visualize newly-born neurons. The GFAP and DCX data are presented as mean±SEM (n = 10 in each group). (c, d) Representative photomicrographs of astrocytic GFAP immunostaining in hippocampus. Scale bar = 100 μm. (e, f) Representative photomicrographs of hippocampal DCX staining. Scale bar = 50 μm.

