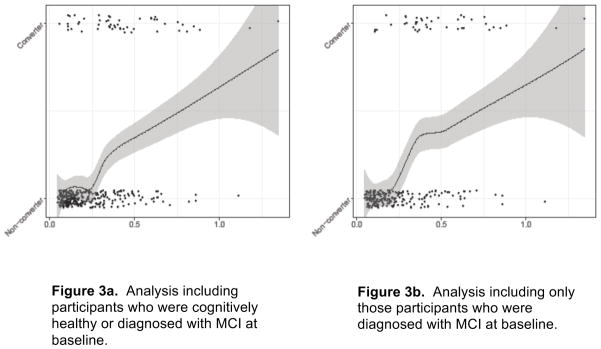
Figure 3.
Ratio of CSF p-tau181/Aβ42 vs. Conversion status with local smoothing trend (LOESS). Data are jittered around conversion status to better illustrate data densities. Figure 3a includes participants with MCI and those who were cognitively healthy at baseline (N=349). Figure 3b includes only those individuals with MCI at baseline (N=244).
Notes:
Conversion is a dichotomous variable: Converters vs. Non-converters. The trend line is smoothed using LOESS in order to illustrate the relationship between conversion and CSF biomarkers without linearity assumptions. Additionally, values for the ratio of CSF analytes were jittered to more clearly see the number of participants obtaining individual ratio values.

