
Figure 9.
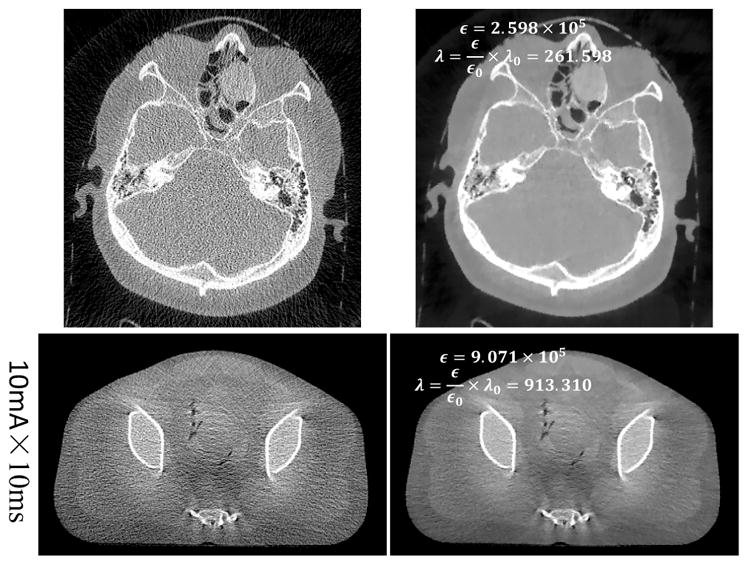
Reconstructed images of the HN patient case (row 1) and the an-thropopathic physical phantom (row 2). Images in the left and right columns correspond to the reconstructions with the FDK and the regularized iterative reconstruction algorithms, respectively. The estimated ε and the selected λ are displayed in the corresponding regularized reconstructions. The display windows for the first and the second rows are [0 0.4]cm−1 and [0.1 0.3]cm−1, respectively.