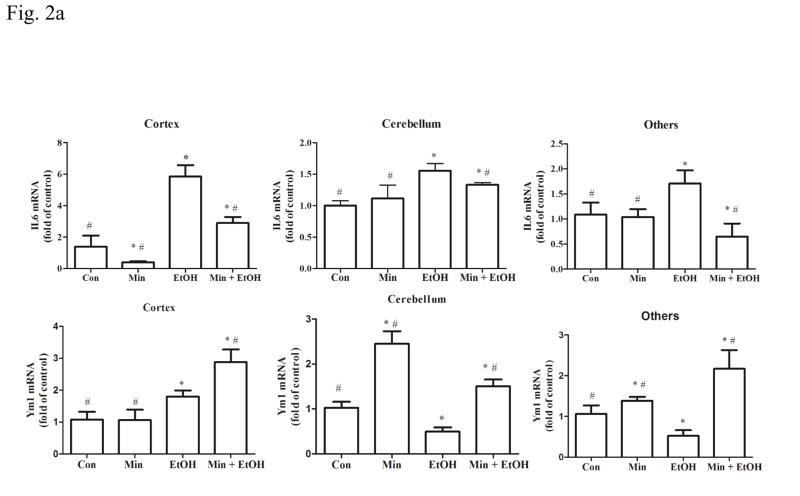
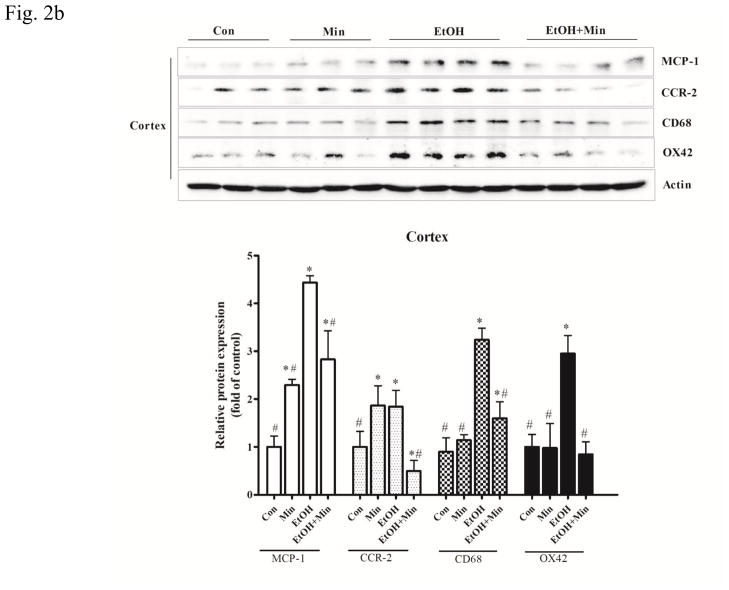
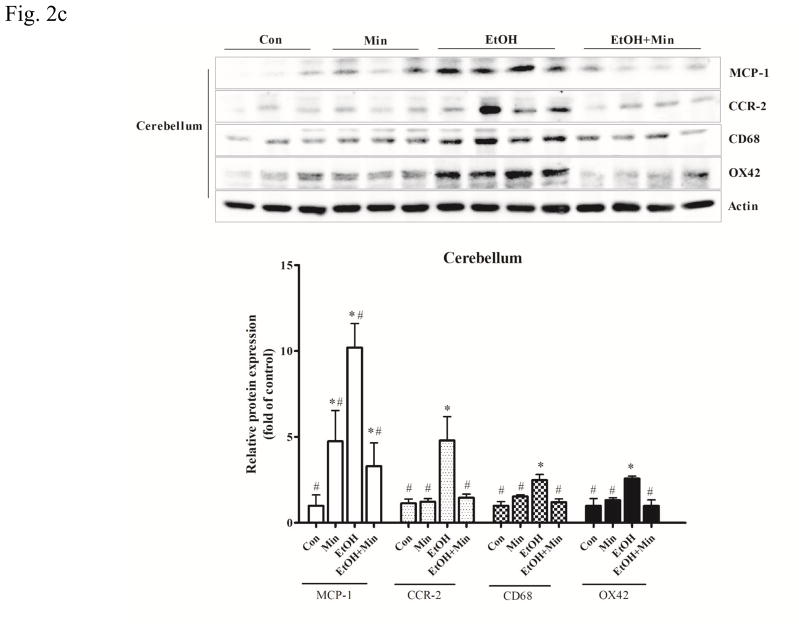
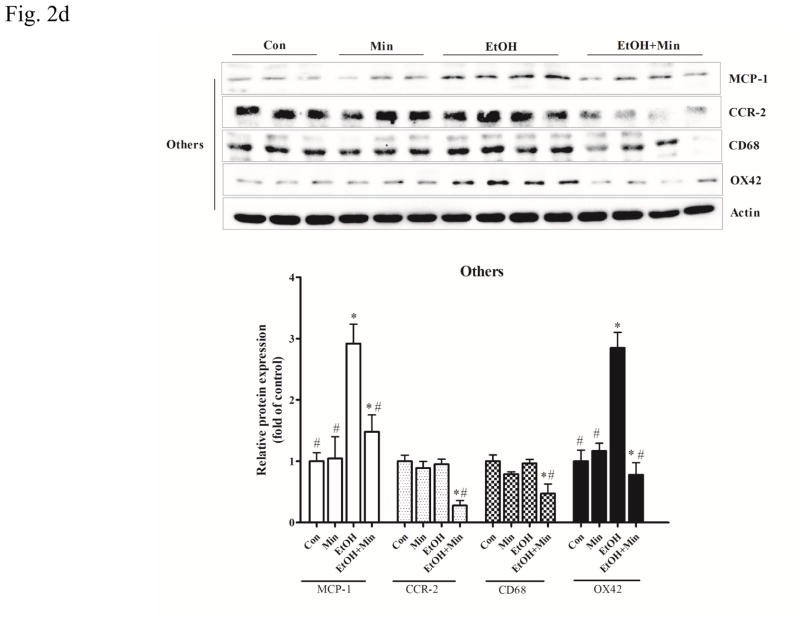
Figure 2.
Effect of minocycline on ethanol-induced inflammation. The treatment of minocycline and ethanol was same as described in Fig. 1. A: The levels of mRNA for IL-6, a pro-inflammatory cytokine, and Ym-1, an anti-inflammatory cytokine in the cortex, cerebellum and other part of brain were determined by qRT-PCR using 18s as an internal control. Minocycline- or ethanol-induced changes were expressed as fold difference over the control. Data are the mean ± SEM of three independent experiments. N = 8 for each group. *p < 0.05, statistically significant difference from control group, #p < 0.05, statistically significant difference from ethanol group. B–D: The expression of MCP-1, CCR-2, CD-68 and OX42 in cortex, cerebellum, and other parts of the brain were determined with immunoblotting. The expression of actin served as an internal control. The relative amounts of indicated proteins were quantified microdensitometrically and normalized to the expression of actin. Each data point was the mean ± SEM of three independent experiments. n = 10 for each group. *p < 0.05, statistically significant difference from control group, #p < 0.05, statistically significant difference from ethanol-treated group.


