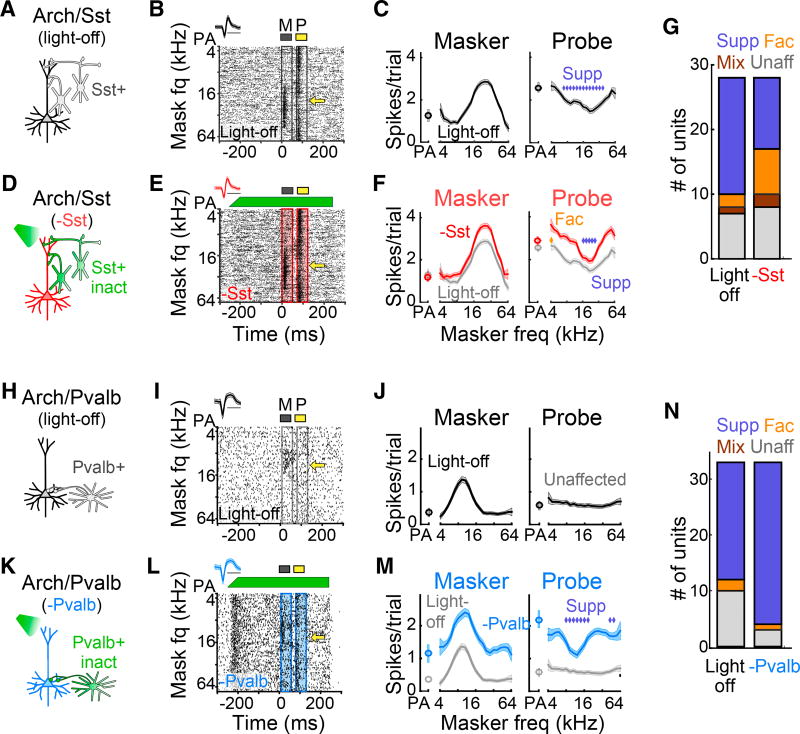
Figure 2. Inactivation of Sst+ versus Pvalb+ Interneurons Differentially Alters the Quality of Forward Interactions.
(A) Schematic of the circuit during light-off trials.
(B) Single unit response raster from light-off trials. Yellow arrow, probe frequency. Inset: spike waveform (scale bar, 1 ms).
(C) Responses (mean ± SEM) to the masker and probe as a function of masker frequency in light-off trials. Blue diamonds, significantly suppressed probe responses.
(D) Schematic of the circuit during light-on trials, in which Sst+ cells are inactivated with green light.
(E) As (B) for light-on trials. Green bar, light duration and power.
(F) As (C) for Sst+ inactivation trials (red) versus light-off trials (gray). Sst+ inactivation produces a mixture of suppression and facilitation. Blue diamonds, suppressed probe responses; gold diamonds, facilitated probe responses.
(G) Proportion of suppressed, facilitated, mixed, and unaffected units without (left) and with (right) inactivation of Sst+ cells.
(H–M) As (A)–(F) for a single unit in which inactivation of Pvalb+ cells (blue) reveals forward suppression. As (A)–(F): circuit schematic in light-off (H) and light-on (K) trials, single unit response raster for light-off (I) and light-on (L) trials, and masker and probe responses for light-off (J) and light-on (M) trials, for a single unit inwhich inactivation of Pvalb+ cells (blue) reveals forward suppression.
(N) As (G) for inactivation of Pvalb+ cells.
See also Figures S1 and S2.

