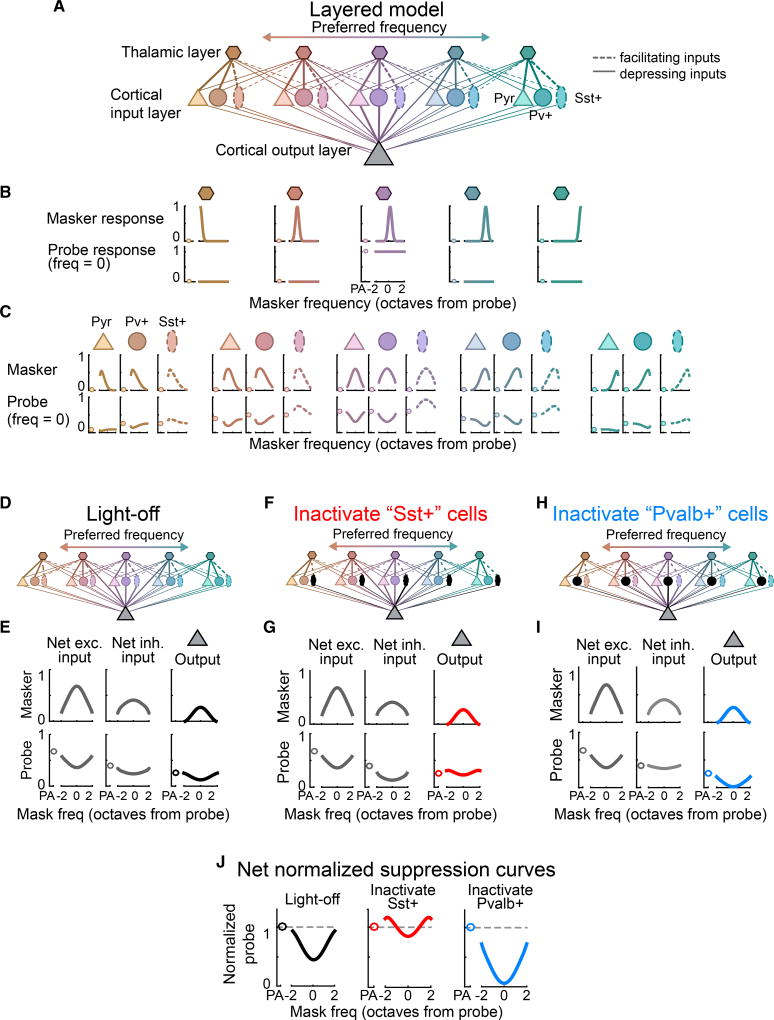
Figure 4. Short-Term Synaptic Dynamics Produce Diverse Effects on Forward Suppression.
(A) Schematic of the layered linear threshold model. Solid lines, depressing inputs; dotted lines, facilitating inputs (only to Sst+ cells).
(B) Top row: responses of each thalamic neuron to masker tones as a function of frequency (units, octaves from the probe frequency). Bottom row: responses of each thalamic neuron to probe-alone (circles) and masked-probe trials as a function of masker frequency (lines).
(C) As (B) for neurons in the second layer, which receive either depressing inputs (Pyr and Pvalb+) or facilitating inputs (Sst+).
(D) Schematic of a network with both Sst+ and Pvalb+ interneurons (no inactivation).
(E) Net excitatory input (left), net inhibitory input (center), and output (right) of the cortical output neuron without inactivation of interneurons.
(F and G) As (D) and (E) with inactivation of Sst+ interneurons (inhibition from depressing Pvalb+ cells remains).
(H and I) As (F) and (G) with inactivation of Pvalb+ interneurons (inhibition from facilitating Sst+ cells remains).
(J) Normalized suppression curves for the output neuron without inactivation, with inactivation of Sst+ interneurons, and with inactivation of Pvalb+ interneurons.

