
Figure 1.
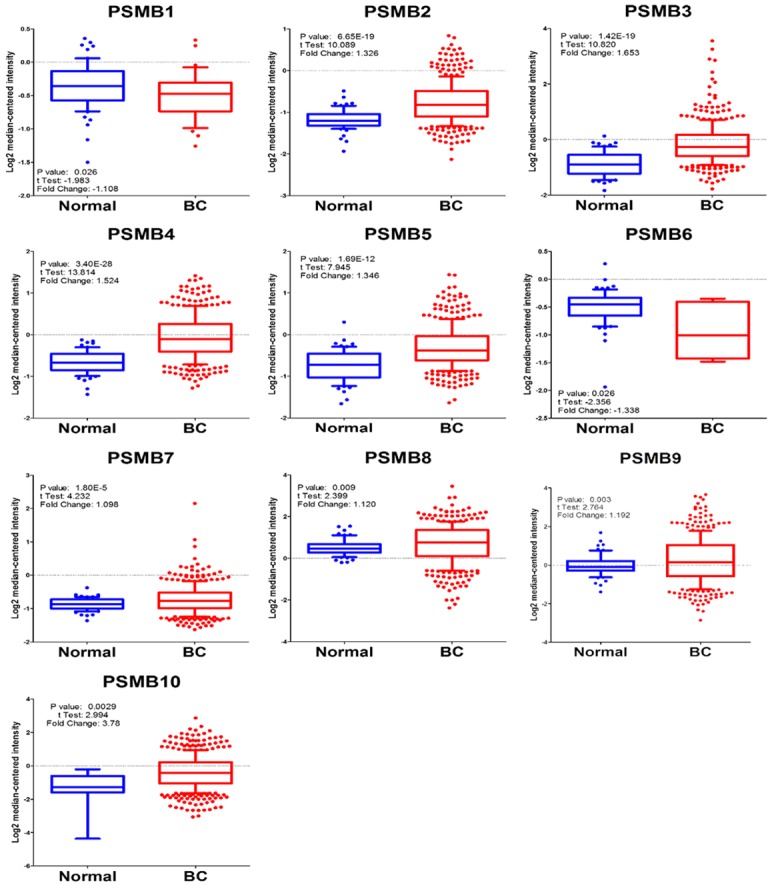
Analysis of PSMB family subunits using breast cancer TCGA database (n=593). Comparison of the PSMB family subunits expression levels between the tumor and corresponding normal tissues obtained from 593 breast cancer patients. The breast TCGA dataset was obtained from Oncomine software which embedded in the TCGA database (https://tcga-data.nci.nih.gov/tcga). Box plots derived from gene expression data in breast cancer TCGA database demonstrating the differential expression of specific PSMB subunits in normal (left) and breast cancer tissues (right, BC), P value < 0.05 considered significant.