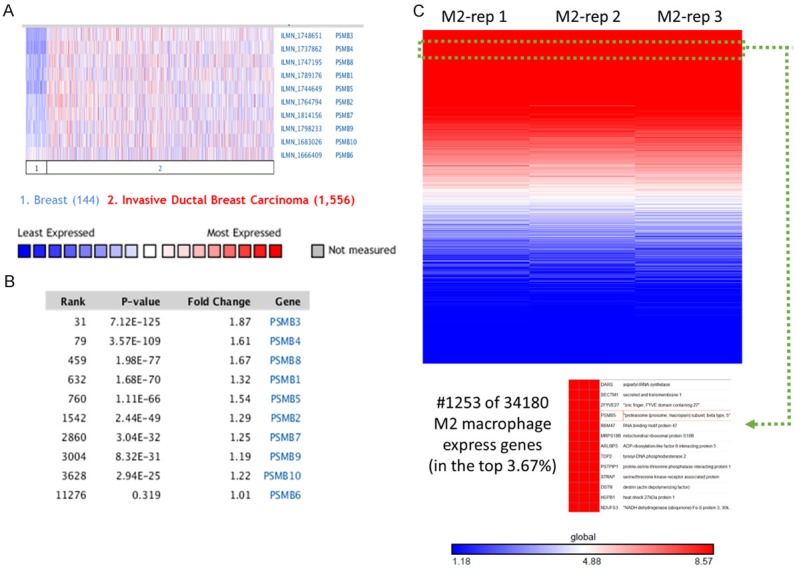
Figure 4.

Identification of PSMB subunits mRNA expression in a variety of public database. A, B. Comparison of selected genes in METABRIC breast cancer database (n=1700). Over-expression of PSMB subunits in invasive ductal breast carcinoma vs. normal breast tissues (log2 median-centered intensity). C. Analysis of published microarray dataset (GSE34180) indicated that PSMB5 as highly expressed in M2 macrophage model. The heatmap shows genes rank ordered from highest to lowest for raw expression values across all M2 macrophage samples. The inset (bottom) highlights expression for PSMB5 ranked number 1253 out of over 34180 genes in the whole microarray dataset, which also means that PSMB5 had high expression in the top 3.67% gene ranking from these M2 macrophage samples.
