
Figure 7.
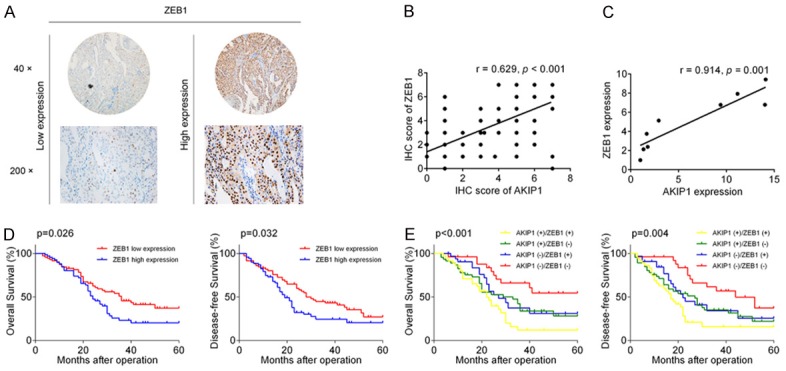
Expression of AKIP1-ZEB1 axis and prognostic significance in NSCLC patients. A. Representative IHC images of ZEB1 in NSCLC specimens. B. Scatter plot of AKIP1 and ZEB1 expression in NSCLC tissues. C. Correlation between AKIP1 expression and ZEB1 expression in NSCLC cell lines. D, E. A Kaplan-Meier analysis of ZEB1 or AKIP1/ZEB1 different combination in NSCLC tissues.