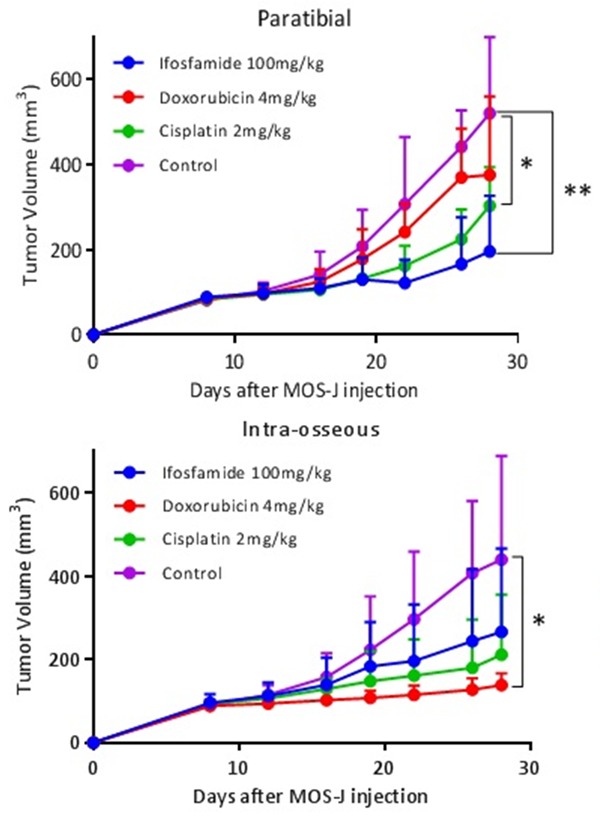
Figure 8.

Kinetics of average tumor volumes according to different injection sites and treatments (cisplatin 2 mg/kg, doxorubicin 4 mg/kg, ifosfamide 100 mg/kg and control group). The treatment was introduced on D12. Thresholds of significance: *: [0.05; 0.01 [, **: [0.01; 0.001 [, ***: ≤ 0.001.
