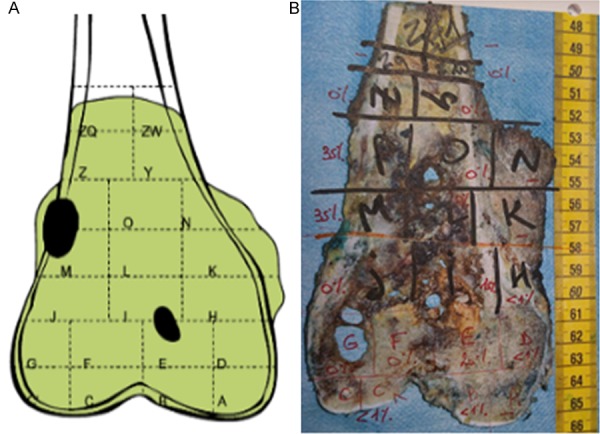
Figure 11.

Frontal section of the distal femur resection piece of patient n°1. Schematic representation of areas where viable tumor cells were observed (A), in black: focal colonies with high cell density (one between soft tissues, cortical bone and cancellous bone, the other in cancellous bone), in green: necrotic tumor. Picture identifying the different slides with percentage of residual viable tumor cells in red (B).
