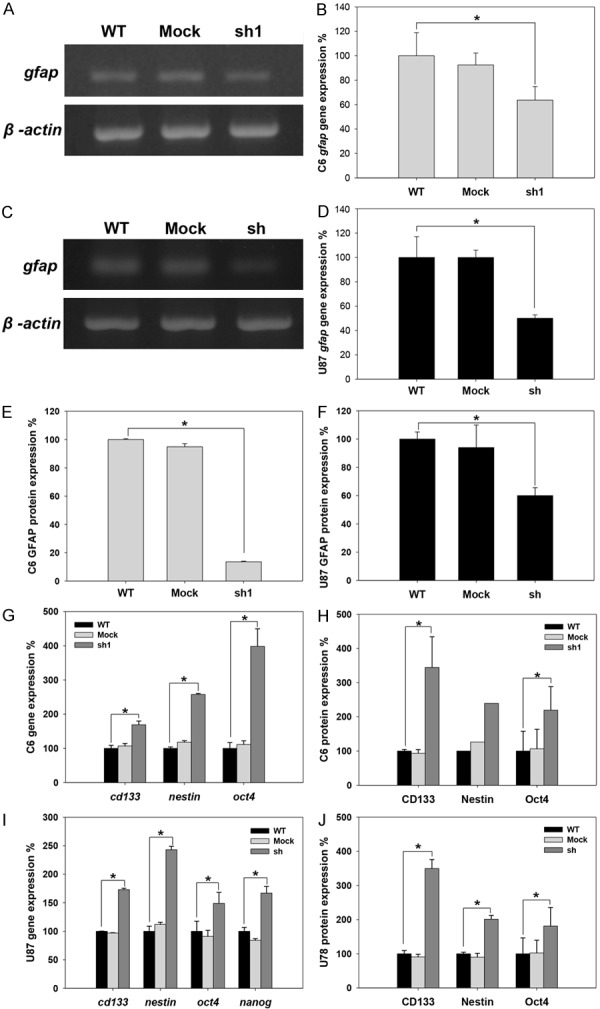
Figure 3.

Expression level of the glial cell differentiation marker (GFAP) and stem cell markers (CD133, nestin, oct4 and nanog) in C6 and U87 cell lines. The expression levels of stem cell markers were analyzed at the same cell density (approximately 3×10⁶ cells/10 cm culture dish) at both the transcriptional and translational levels in C6 and U87 cells. A. The expression of the GFAP mRNA in C6 cell lines. B. Quantification of GFAP mRNA expression in C6 cell lines. C. The expression level of GFAP mRNA in U87 cell lines. D. Quantification of GFAP mRNA expression in U87 cell lines. E. Statistical analysis of GFAP protein expression in C6 cell lines detected using flow cytometry. F. Statistical analysis of GFAP protein expression in U87 cell lines detected using flow cytometry. G. The expression levels of the CD133, nestin and Oct4 mRNAs were detected in C6 cell lines using RT-PCR. H. The protein expression levels of CD133, nestin and Oct4 were detected in C6 cell lines. CD133 and Oct4 expression levels were detected using flow cytometry, and nestin expression was detected using Western blot analysis. I. The gene expression levels of CD133, nestin, Oct4 and nanog were detected in U87 cells using RT-PCR. J. The expression levels of the CD133, nestin and Oct4 proteins were detected in U87 cell lines using flow cytometry (*p value < 0.05).
