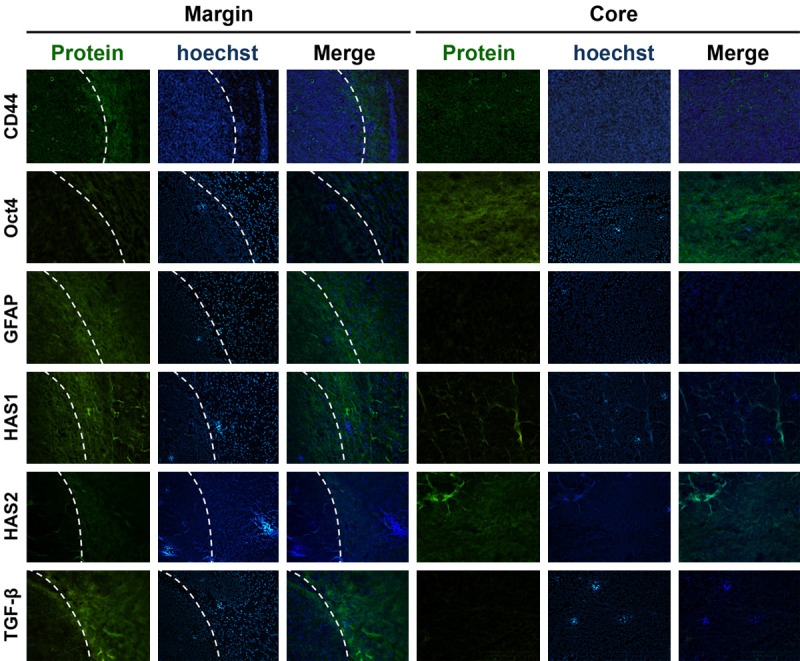
Figure 4.

The distribution of the CD44, Oct4, GFAP, TGF-B, HAS1 and HAS2 proteins in rat glioma. Photomicrograph of a C6 rat glioma section stained using immunofluorescence for CD44, Oct4, GFAP, TGF-B, HAS1 and HAS2 (green) at its margin (left) and core (right). The white dotted line in the left panel indicates the edge that separates the tumor core from the invasive rim. Blue indicates Hoechst-stained cell nuclei.
