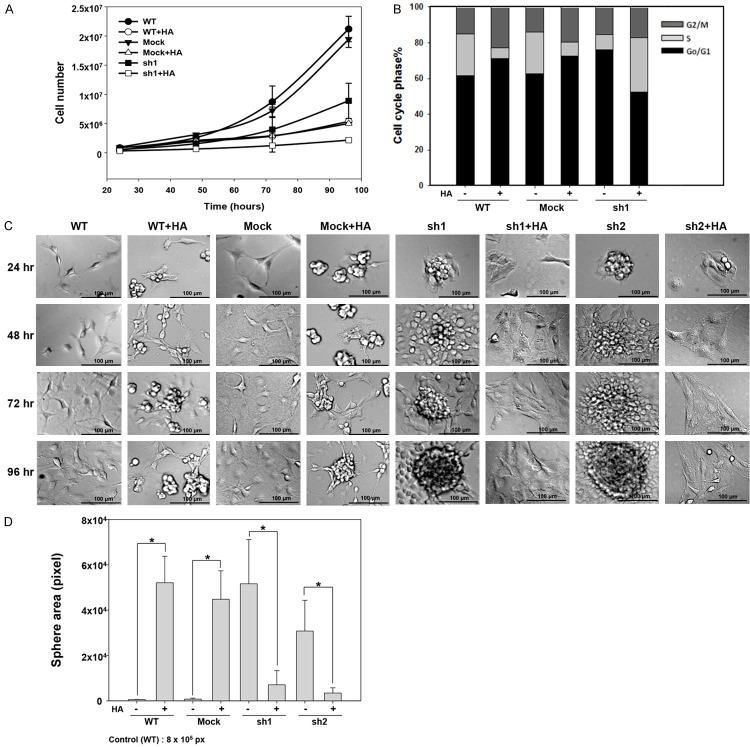
Figure 6.
Cell proliferation and sphere formation affected by HA. A. Growth curve in C6 cell lines treated with HA+. n = 3. B. Cell cycle analysis of C6 cell lines treated with HA+. C. Morphology of C6 cell lines treated with HA+. Scale bar = 100 μm. D. Statistical analysis of sphere formation ratios in C6 cell lines (*p value < 0.05).

