Figure 8.

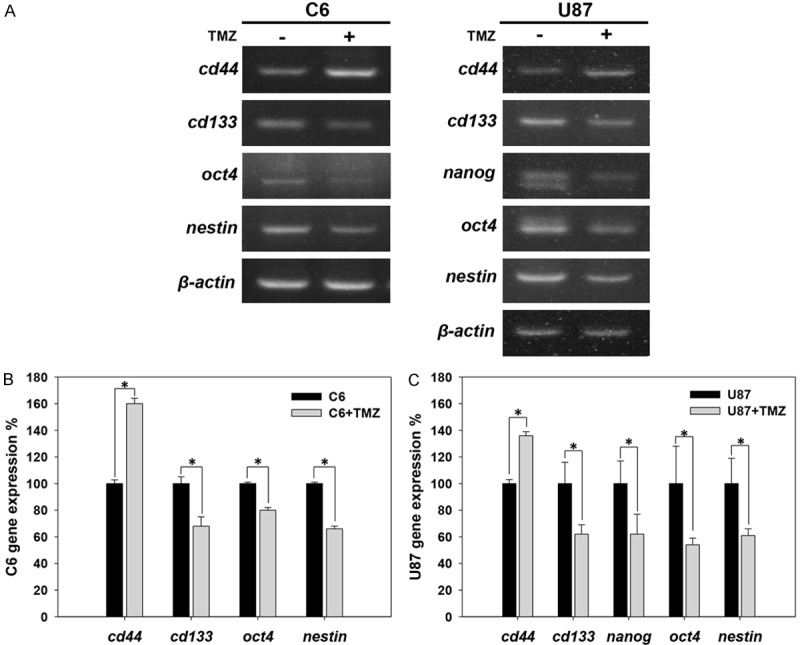
Expression of CD44 and GSCs markers in response to TMZ in C6 and U87 glioma cell lines. The expression levels of cd44, cd133, oct4, nanog and nestin in C6 and U87 cells treated with TMZ were analyzed using RT-PCR. (A) Analysis of cd44, cd133, oct4, nanog and nestin gene expression at 96 hours after treatment with 25 μg/ml TMZ. The results were analyzed using RT-PCR. The bar graph shows the quantification of the expression of these genes in (B) C6 and (C) U87 cells treated with or without TMZ (*p value < 0.05).
