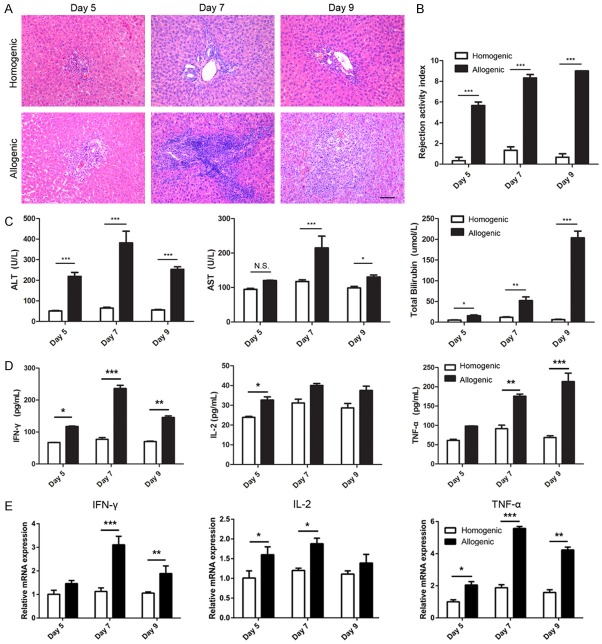
Figure 1.
Time course of pathologic characteristics of liver grafts on days 5, 7, 9 after LT. A: Analysis of pathologic characteristics of allogenic and homogenic groups by H&E staining (original magnification, 200×). B: Bar graph showing the rejection activity index (RAI) results in two groups. C, D: Analysis of serum levels of ALT, AST, TBIL and cytokine (IFN-γ, IL-2 and TNF-α). E: Relative RNA expression for cytokine genesin liver grafts of allogenic and homogenic groups detected by qPCR, GAPDH was used as loading controls. All data representative of three independent experiments and calculated data are shown as mean ± SD. All statistical analyses were performed by student t test, *p<0.05, **p<0.01, ***p<0.001 compared to homogenic group.

