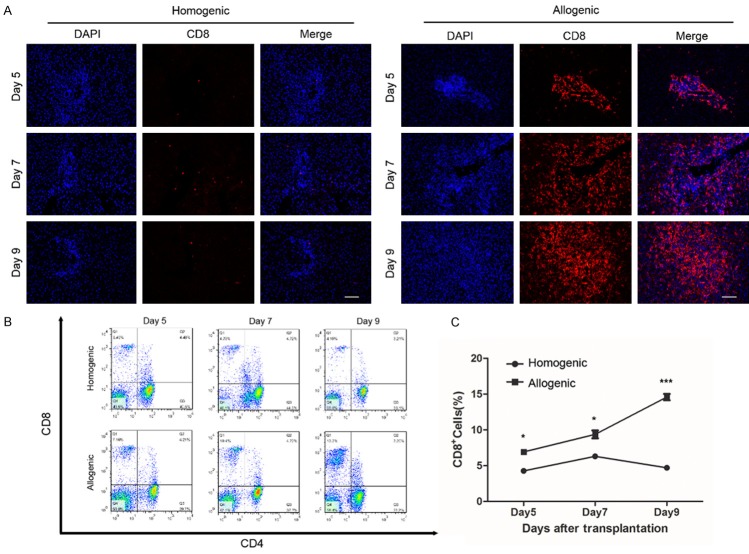
Figure 2.
The ratio of CD8+ T cells in liver grafts and peripheral blood on days 5, 7, 9 after LT. A: Immunofluorescent staining for CD8 in liver grafts of allogenic and homogenic groups (original magnification 200×). CD8 antibody was labeled with cyanidin-3 (red) and cell nucleus was labeled DAPI (blue). B, C: Flow cytometry analysis of ratio of peripheral CD8+ T cells in allogenic and homogenic groups. All data representative of three independent experiments and calculated data are shown as mean ± SD. All statistical analyses were performed by student t test, *p<0.05, ***p<0.001 compared to homogenic group.

