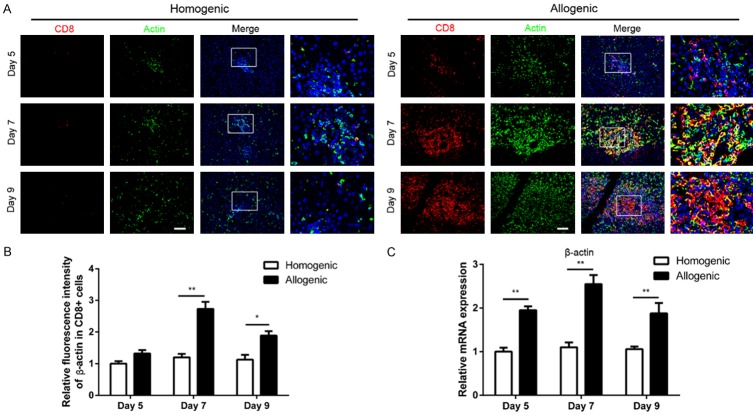
Figure 3.
Alterations of the expression of β-actin in CD8+ T cells in liver grafts on days 5, 7, 9 after LT. A: Triple double fluorescent staining for CD8 (red), β-actin (green) and DAPI (blue) in allogenic group and homogenic group (original magnification 200×). B: Histogram showing relative fluorescence intensity of β-actin expression in CD8+ T cells. C: qPCR was performed to analyze the expression of β-actin in liver tissues, GAPDH was used as loading controls. All data representative of three independent experiments and calculated data are shown as mean ± SD. All statistical analyses were performed by student t test, *p<0.05, **p<0.01 compared to homogenic group.

