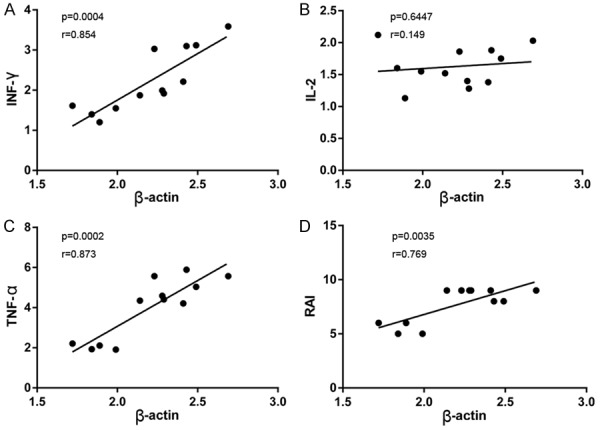
Figure 5.

Correlation analysis in allografts during acute rejection episodes. A-C: Correlation between β-actin and the inflammatory cytokines (IFN-γ, IL-2 and TNF-α) mRNA levels; D: Correlation between β-actin mRNA levels and the severity of allograft rejection which was represented as RAI. Statistical analyses were performed by Spearman’s test to assess any correlation. A probability level of P<0.05 was considered statistically significant.
