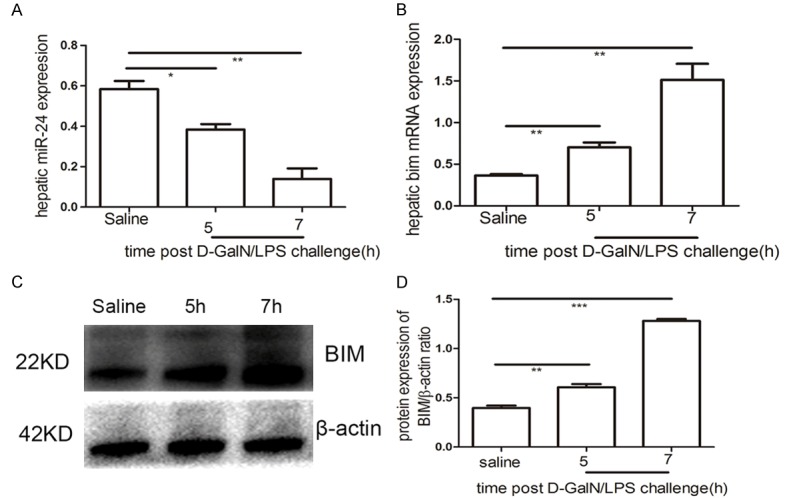
Figure 2.

miR-24 downregulation and BIM upregulation. qRT-PCR analysis of miR-24 (A) and BIM (B) at 5 h and 7 h post D-GalN/LPS challenge compared with saline-treated group. (C) Western blotting analysis of BIM protein expression in the control and experimental groups. (D) Signal was quantified and data was normalized to b-actin. Results are presented as mean ± SD; *P<0.05, **P<0.01 and ***P<0.001 versus the control group.
