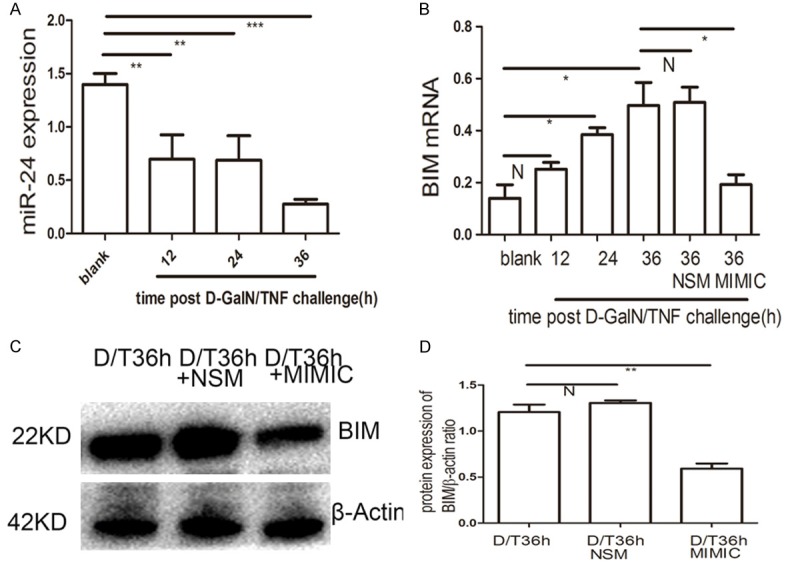
Figure 6.

miR-24 mimic reduces BIM expression in BNLCL2 cells. A. qRT-PCR analysis of miR-24 at different time points post D-GalN/TNF challenge. B. BIM qRT-PCR analysis in BNLCL2 cells transfected with miR-24 mimic or miR-24 non-specific mimic, then followed by stimulation of D-GalN/TNF for 36 h, while the blank group were treated only with DMEM. C, D. BIM western blotting in BNLCL2 cells transfected with miR-24 mimic or miR-24 non-specific mimic. Data represent the mean value of three independent experiments. Mean ± SEM. N, P>0.05; *P<0.05; **P<0.01; ***P<0.001.
